| The Sharpe ratio - part two |
Back |
| In the second of a two part series, Bernard Murphy outlines the impact of the Sharpe Ratio, which can be a useful analytic tool for evaluating the impact of asset allocation decisions across different investment classes, on risk diversification. |
The Mean-Variance Efficient Frontier (MVEF) illustrated in Fig. 3 now defines the set of allocations to individually diversified portfolios that minimize the augmented portfolio (i.e. the ‘fund of funds’) risk for ‘attainable’ values of the expected return.
Using the bespoke financial toolbox in the Matlab software package, a user-specified number of efficient portfolios (100 here) is calculated and plotted along the efficient frontier such that portfolio (expected) returns are equally spaced between the maximum possible attainable return and the minimum risk point for the portfolios. From the diagram we can see that adding some managed futures (MF) and commodity market (GSCI) exposure would involve the equity class investor having to give up some expected return but at the benefit of achieving a significant reduction in fund risk. But what the diagram does not illustrate is how varying the allocation across the asset classes might enhance the Sharpe Ratio measure of fund performance. Remembering that the ‘optimal’ fund-of-funds is again the portfolio with the highest ‘Sharpe ratio’, this effect can be be more clearly seen in figure 3.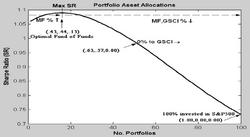 | | portfolio asset allocations |
Implementing the optimal asset allocation across the classes would have created a fund of funds with a historical mean excess return of 8.58 per cent but a standard deviation of just 7.87 per cent. Comparing the ‘SR’ of 8.58/7.87 = 1.09 against the 0.73 SR for the 100 per cent S&P500 fund shows the trade-off benefits of ‘portfolio mixing’ to the risk-averse investor. In point of fact, the diagram clearly illustrates that a relatively moderate allocation to the Managed Futures and Commodity asset class over the period would have achieved superior risk-adjusted performance results for the equity class investor - peaking at an optimal allocation of 44 per cent to the MF class and 13 per cent in the case of the Commodity class. But that’s not even telling the whole story.
Although not reported in the Table, the positive skewness and mild excess kurtosis estimated for the Managed Futures returns distribution - along with the negative correlation with the S&P500 returns - further confirms the potential for this asset class to be an effective diversifier. However, this desirable ‘by-product’ of portfolio mixing is not captured by the Sharpe Ratio criterion which as explained earlier only considers the standard deviation of the returns distribution in evaluating the relative performance of an investment fund.
Negative skewness and excess kurtosis of returns are important risk characteristics of the empirical returns distribution which indicate the likelihood of infrequent or ‘one-off’ large negative returns - events which can quickly negate the benefit of several years of positive compounded returns. Although not reported here our calculations1 show that increasing the allocation to the Managed Futures class in particular will in fact reverse the negative skewness typically reported for a 100 per cent allocation to the equity class distribution whilst not materially adversely affecting the excess kurtosis.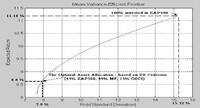 | | Figure 4 - Sharpe Ratio as a function of Asset Allocation |
In conclusion, the Sharpe-Ratio criterion can be a useful analytic tool for evaluating the impact of asset allocation decisions across different investment classes. Nonetheless, new recruits to the asset and investment management industry should be aware of the limitations of the criterion when other desirable effects (positive skewness, reduced excess kurtosis) of portfolio mixing should also be taken into account. In light of the developing ‘mainstream’ acceptance of alternative investment strategies these effects will require careful analysis in the context of cross asset class allocations, whether they be to the hedge fund class or indeed to other classes such as the managed futures class outlined in this analysis.
1 Details available from the author on request at bernard.murphy@ul.ie. The results have been derived independently of a similar study by Kat (see Footnote 2) but are consistent with the results discussed in that paper. Moreover the study uses a statistical technique for estimating portfolio means and covariances which allows the analyst to gauge the statistical significance of the estimated cross-asset correlations - an important issue in the context of pro-forma asset allocation decisions. |
Dr. Bernard Murphy lectures in derivatives and financial engineering at the University of Limerick.
|
| Article appeared in the July 2005 issue.
|
|
|