| Sharpe practices in evaluating investment performance |
Back |
Bernard Murphy outlines the uses and limitations of the Sharpe Ratio, which can be a useful analytic tool for evaluating the impact
of asset allocation decisions across different investment classes. Next month he looks at its impact on risk diversification. |
Students of portfolio theory and new recruits to the asset and investment management industry will be familiar with the notion of the positive risk-return trade-off inherent in securities markets investment. The Mean-Variance Efficient Frontier (MVEF) for example defines the set of mean portfolio returns for which the corresponding portfolio risk (i.e. standard deviation) has been minimised. For a target (or desired) level of expected return, construction of the efficient frontier involves solving for the corresponding set of optimal weightings or percentages of initial wealth which an investor should allocate to each asset in the portfolio in order to minimise risk.
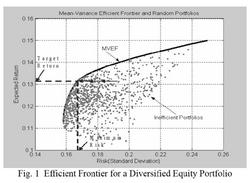 | | Efficient frontier for a diversified equity portfolio |
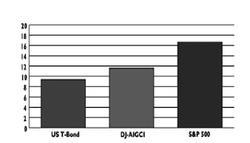 | | Comparison of Volatilities |
When combined with the possibilities afforded by leverage the MVEF allows the selection of portfolio strategies which maximise the reward-to-risk ratio for given risk-preferences of investors - for example, whether cautious or aggressive.
For a given portfolio investment strategy the Sharpe Ratio (SR) measures the excess expected return over the benchmark risk-free rate per unit of portfolio risk and is typically represented as:
The Sharpe Ratio criterion is therefore an explicit measure of reward to (total) risk, or equivalently of the ‘risk-adjusted’ performance of an investment portfolio trading in a given asset class - the higher the ratio the more efficiently the fund has traded-off return for risk!
In order to appreciate both the uses and limitations of the criterion in investment analysis, we analyse historical returns for a number of ‘asset classes’ (equity, commodity and managed futures) which are the focus of both traditional and alternative styles of investment management.
First, we look at a fundamental risk measure for these asset classes - the standard deviation of portfolio returns. The chart following demonstrates that for the historical period 1993-2003 investing in a diversified commodity fund (e.g. the DJCI Dow Jones Commodity Index, or in the analysis following the GSCI Goldman Sachs Commodity Index) would have been less risky (i.e. the returns were less volatile) than a diversified investment in the equity class as represented by the S&P500 benchmark index portfolio.
The Table following similarly demonstrates that investing in the managed futures asset class would have been less risky than both a diversified investment in the equity class and one in the commodity class. However, as any student of modern portfolio theory will quickly opine - you don’t get something for nothing according to the risk-return trade-off principle! Unfortunately, this indeed appears to be the case as, in the case of the managed futures class, the mean annualised return on the MF fund was some 4.17 per cent less than that of the S&P500 and moreover has a Sharpe Ratio value of 0.58 compared to 0.73 for the equity fund. The diversified commodity fund has an even worse SR value of 0.32!
Naive interpretation of the Sharpe Ratio would apparently suggest therefore that rational risk-averse investors, who presumably should only invest in the asset class which has historically offered the best stand-alone risk-adjusted returns, should never look beyond the equity class! Of course, this ignores the potential for even further risk diversification offered by allocating investment exposure across the other asset classes considered in Table 1. Consequently, we explore this issue next.
1 Data sources available from author on request.
2 Managed Futures (MF) funds adopt a trend following investment style -- long or short, the fund seeks to profit from correctly anticipated directional movements in a futures price (or index). Moreover, MF funds dynamically adjust exposure when the market moves in an ‘adverse’ direction and therefore tend to have lower historical volatility as well as more desirable skewness characteristics than the return distribution for a 100 per cent invested diversified equity portfolio. |
Dr. Bernard Murphy lectures in derivatives and financial engineering on the MSc in Financial Services programme in the Department of Accounting & Finance, Kemmy Business School, University of Limerick.
|
| Article appeared in the May 2005 issue.
|
|
|